Gantt chart. Part 3
Contents
- Gantt chart with D3
- Gantt chart with D3. Part 2
- Gantt chart with Canvas (you are here)
- Gantt chart with CSS Grids
I have been writing about and improving on my Gantt chart implementation for quite some time now.
It all started with this (blog):
Then I added few features (blog):
Back then I have promised to re-write the implementation in Canvas. And so I did.
Curious fact: I did not plan on doing this at this time - it was a private email from darekeapp12 who wrote this:
I have looked at your blog for Gantt chart and implementation. I am doing a project using React and Node/Express and need to implement Gantt chart that is also draggable i.e. the bars can be moved and also resized from either end. I have researched heavily but could not find anything. I am thinking if there is no library, something could be built from scratch.
The sender seemed dodgy (DAREKE app) so I did not want to reply to avoid unnecessary spam subscriptions, but I was happy to improve my old project.
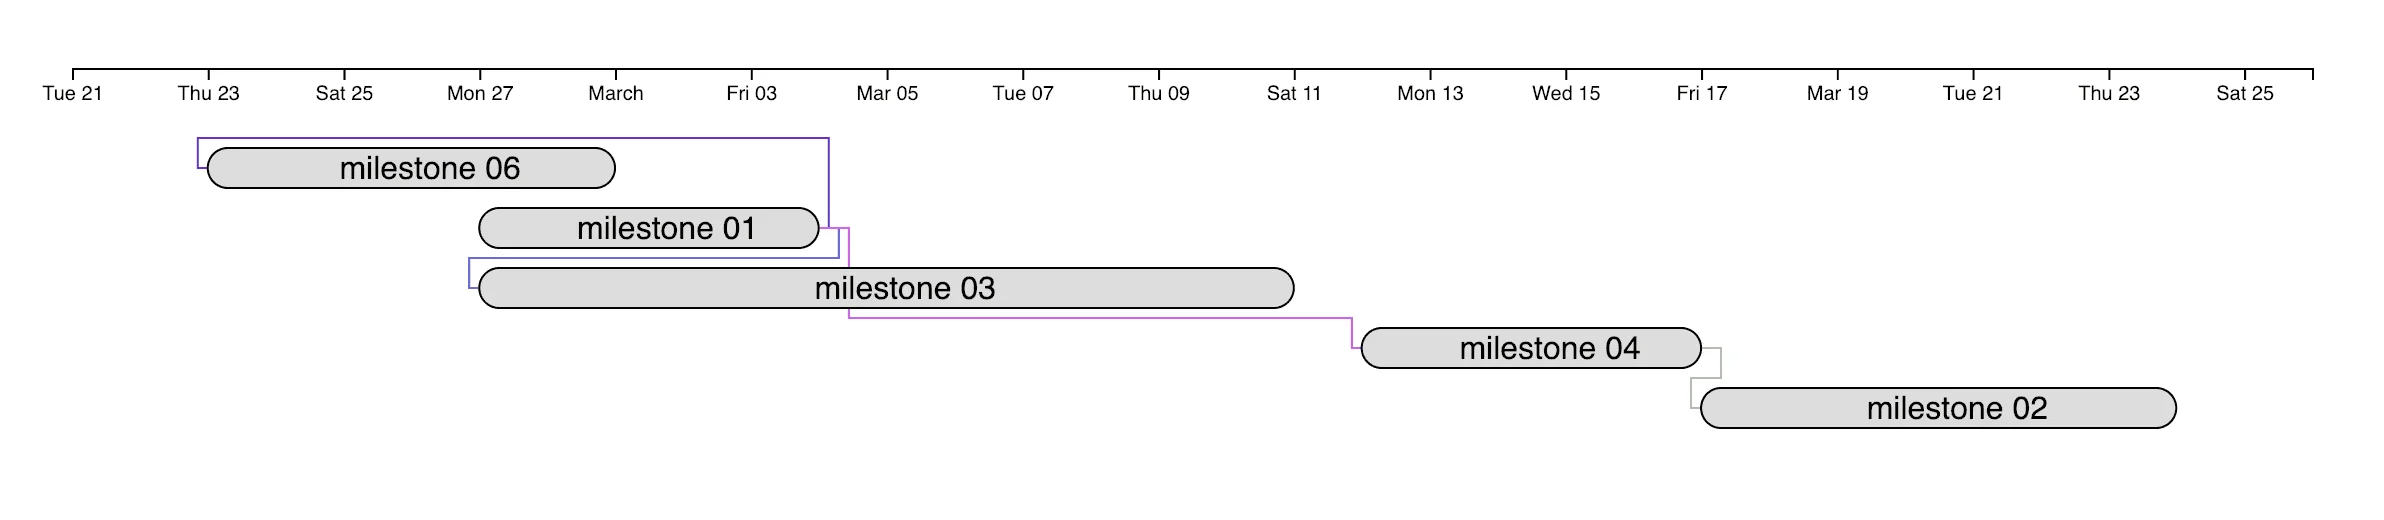
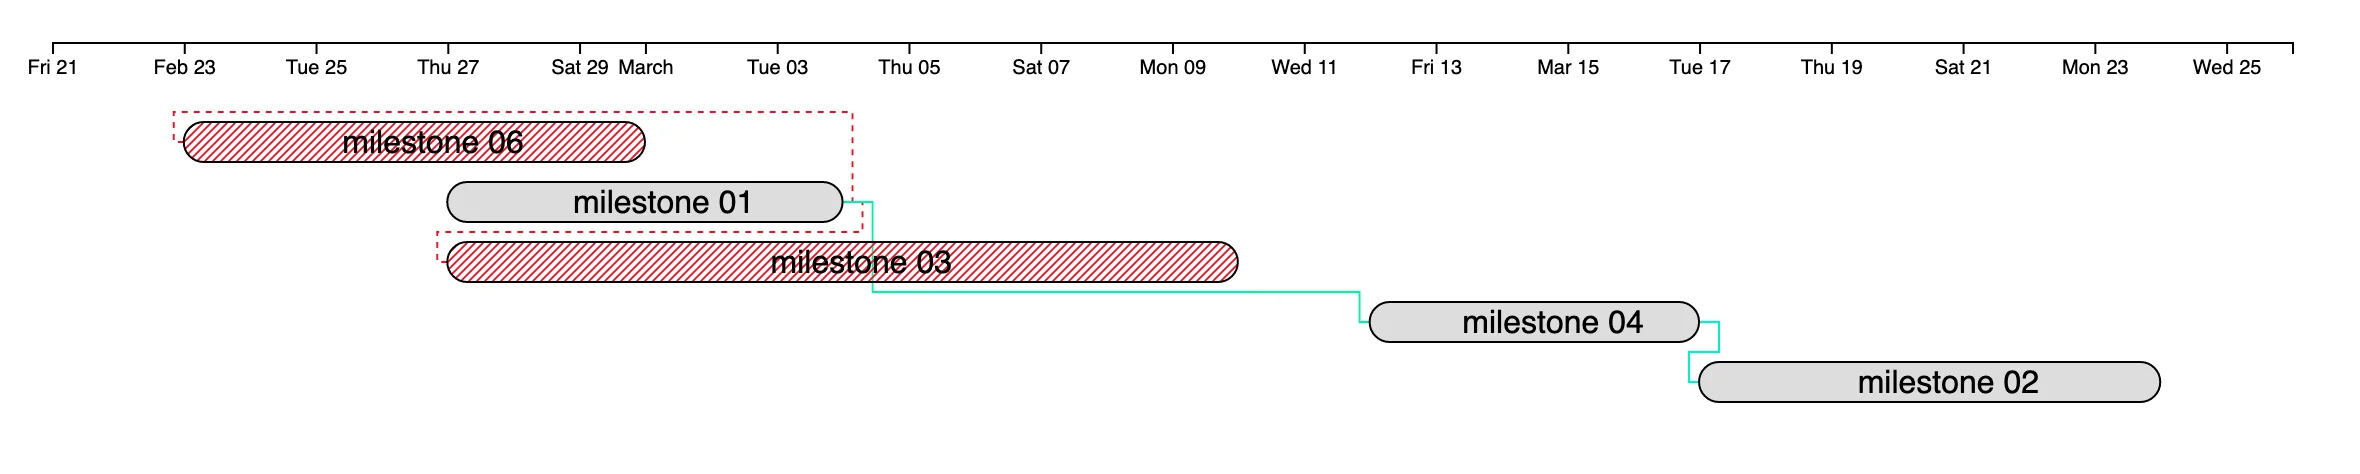
Here are few new features and improvements added to the chart:
- scrolling and zooming in & out is now a thing
- you can drag the milestones around and stretch & shrink them
- an event will be fired whenever a milestone is changed (moved / stretched / shrinked)
- dependencies are now typed: start-to-start, end-to-end or end-to-start are the only supported types
Here, you can even play around with it now!
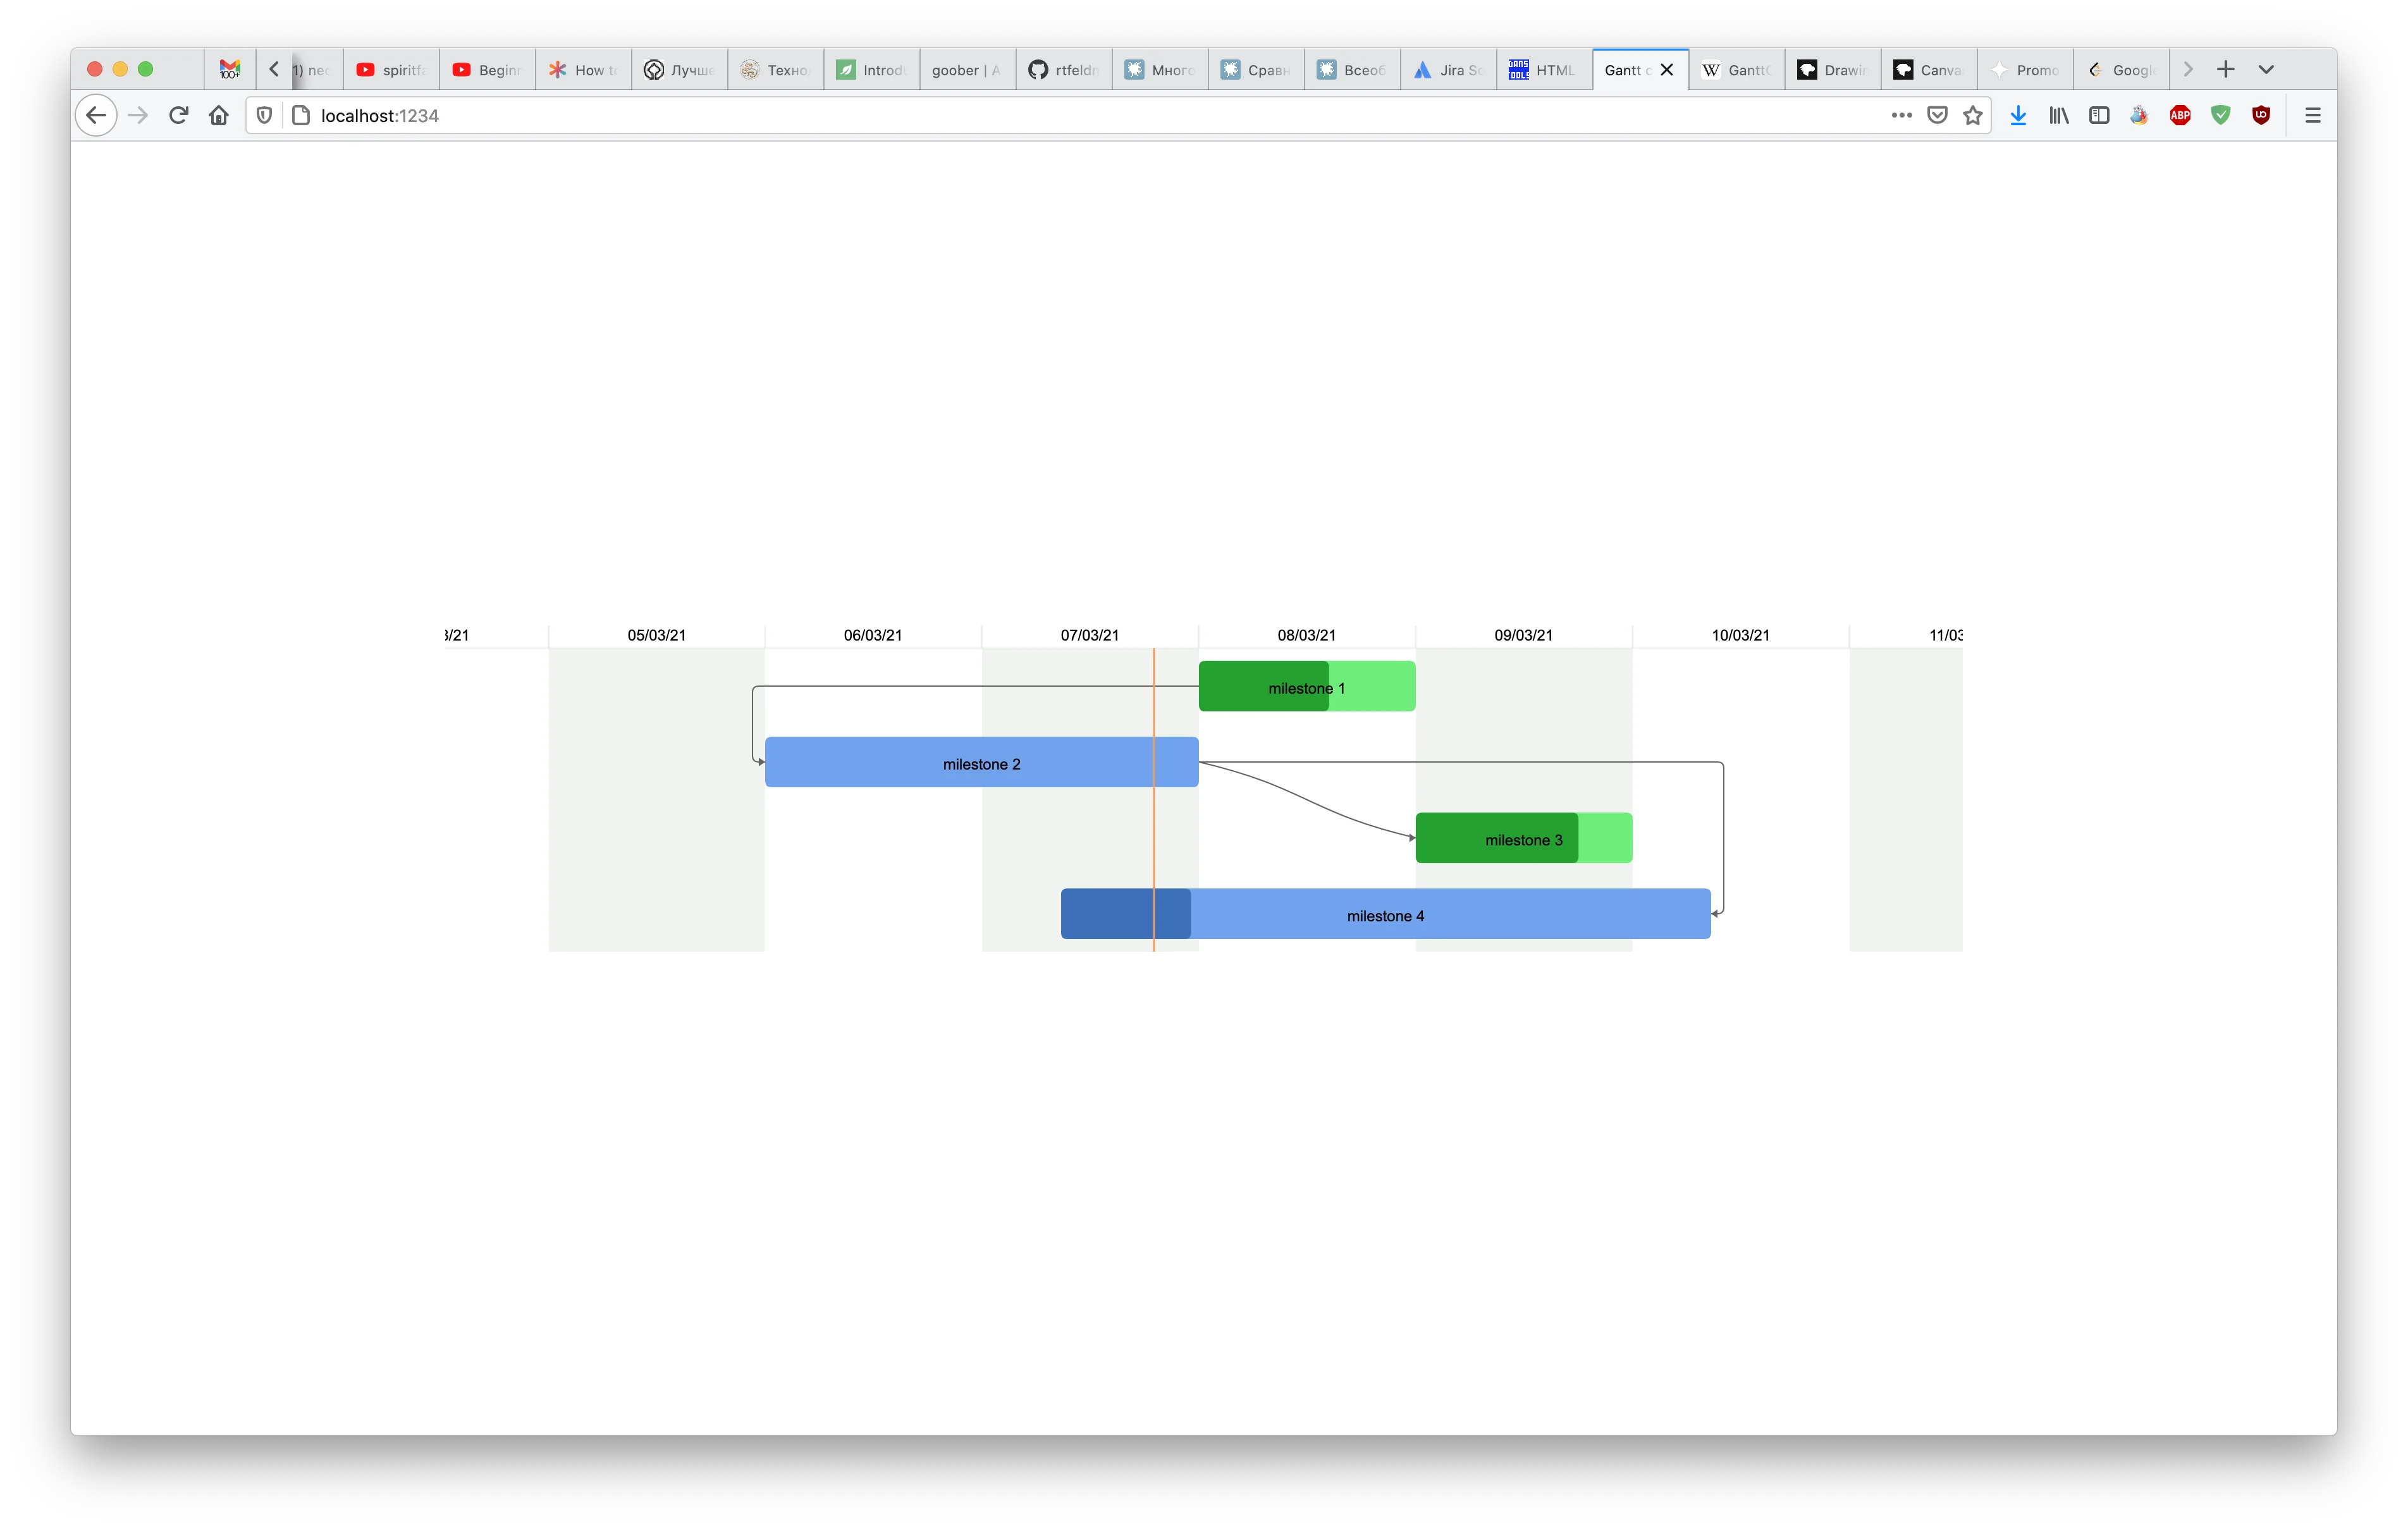
More about the implementation specifics under the cut.
The main goal I had in mind was getting rid of D3, since it is a rather heavy dependency which is only used for few rather simple functions. By the end of this rework I ended up adding a ton of visual and functional improvements to the implementation, but I’ll talk about it in detail later.
To start with, I created a function to convert a timestamp into a position on canvas. This requires knowing the boundaries of timeline and canvas to be able to map the beginning of a timeline to a beginning of canvas. I started off by trying to figure out the formulae myself, but quickly realized it is not as simple as few additions and divisions (well, it actually is, but it is tricky to figure out from start). So I turned myself to the maths - linear interpolation, to be specific.
If we know the beginning of a range and the end of a range and values they map to, in order to figure out the corresponding mapping of a point on that range, we can utilize linear interpolation (given the range values changes linearly, which is true, since we work with time span on one hand and canvas coordinates on the other).
Here’s a visual representation of what I am talking about:
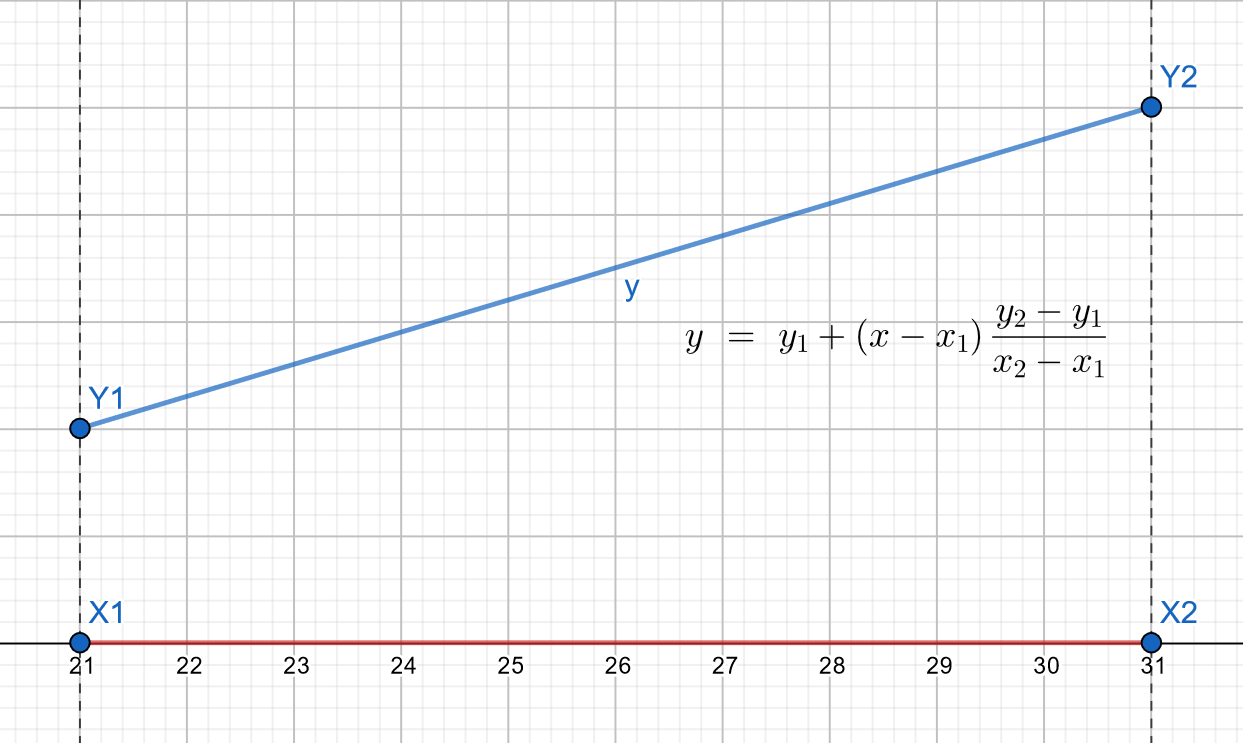
There’s a formulae to tell the y coordinate of a point on a line by its x coordinate if you know two points on that line.
Now in our case, the two known points are the start and the end of the time span.
“But wait, why are we even taling about x and y coordinates?” - you might ask.
A given timestamp can be represented as a single number (number of milliseconds since Unix was started).
That would give us the x coordinate of any given point. The y coordinate would be the x coordinate of the same point
on canvas. We do not care about the y coordinate on canvas, since all the vertical layout will be done later and does not
depend on the timestmap. We will have to arrange elements on the canvas vertically in a different order, so we can easily exclude it
from the interpolation.
Let’s reiterate the formulae:
y = y1 + (x - x1) * ((y2 - y1) / (x2 - x1))Considering the explanation above:
x1is the first timestamp from the time span on a screeny1is the lowest of canvas’xcoordinate (0)x2is the last timestamp from the time span on a screeny2is the highest of canvas’xcoordinate (canvas.width)xis a numeric timestamp valueyis a correspondingxcoordinate of that timestamp on canvas
Substitute these in the formulae:
y = 0 + (x - firstTimestamp) * ((canvas.width - 0) / (lastTimestamp - firstTimestamp))And simplify it:
y = (x - firstTimestamp) * (canvas.width / (lastTimestamp - firstTimestamp))In terms of code, the interpolation function looks like this:
scaleX(date, minStart, overallDuration, canvasWidth) {
  return Math.ceil((date.getTime() - minStart) * (canvasWidth / overallDuration));
}
Now, for a given canvas size and time span range we can figure out the x coordinate of any date (even if it is far out from the time span -
this will actually give us the ability to scroll the chart). Hence we can start drawing both milestones and current time line (marking “now” on a chart).
It is as easy as figuring out the coresponding y coordinate of an object you want to render. For instance, the current time line would start with y = 0 and
end at y = canvas.height. The milestone bars, however, could have their y coordinate calculated as y = milestoneIndex * (milestoneHeight + (verticalPadding * 2)).
And that is what makes the core of the new chart implementation. The rest is a ton of fanciness in form of pretty colors, drag&drop milestones (updating the underlying data) and scaling them, rendering connection lines between them. For the most part it is a combination of plain JS and Canvas API.
The only trick-ier bit is moving and resizing the milestones - if you want to update the underlying milestone data, you will need to have an inverse
of linear interpolation above - you will need to figure out the date based on x coordinate on canvas. This is as simple as swapping the parameters in the interpolation:
instead of y variable representing the x coordinate on canvas, it should represent the date on the time span and x variable should represent the x coordinate
on canvas:
y1is the first timestamp from the time span on a screenx1is the lowest of canvas’xcoordinate (0)y2is the last timestamp from the time span on a screenx2is the highest of canvas’xcoordinate (canvas.width)yis a numeric timestamp valuexis a correspondingxcoordinate of that timestamp on canvas
In JS it looks like this:
scaleDate(x, minStart, overallDuration, canvasWidth) {
  return Math.ceil(minStart.getTime() + (x * (overallDuration / canvasWidth)));
}
Using Canvas for this project sounds reasonable, especially given the time span can potentially be very large. This also enables rendering nice controls and connection (dependency) lines.
However, the big disadvantage of using Canvas is the complexity to use the custom HTML elements for description or other milestone details (for instance, to show the additional details about mileston - goal, assignee, etc.).
This is the reason this implementation is still not a standalone React component - I am still trying to figure out the best way to render the chart.
Anyhow, that’s it for now. I will improve this solution when the time comes.