Gantt chart with D3. Part 2
Contents
- Gantt chart with D3
- Gantt chart with D3. Part 2 (you are here)
- Gantt chart with Canvas
- Gantt chart with CSS Grids
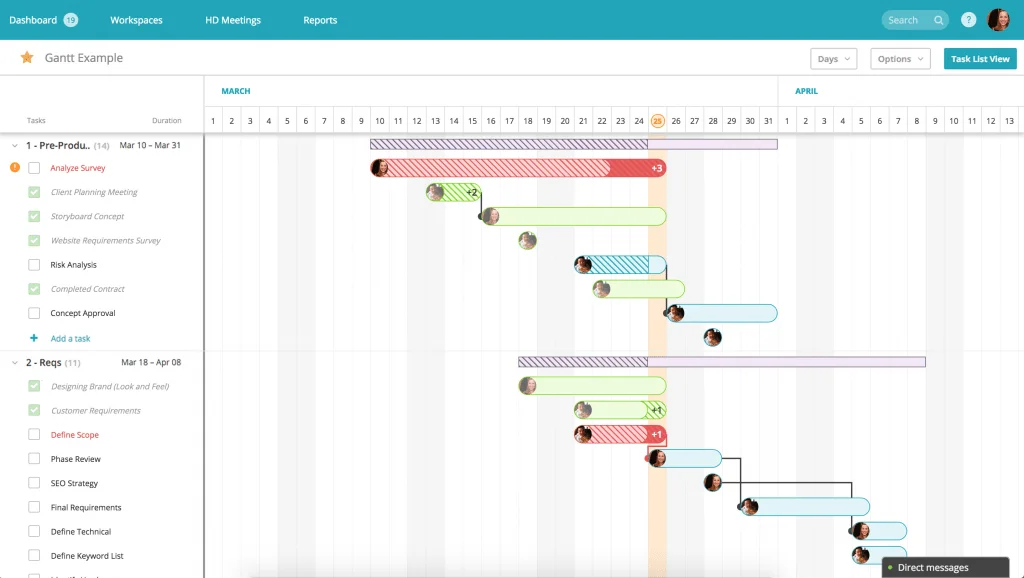
In the original blog I claimed to implement something like this:
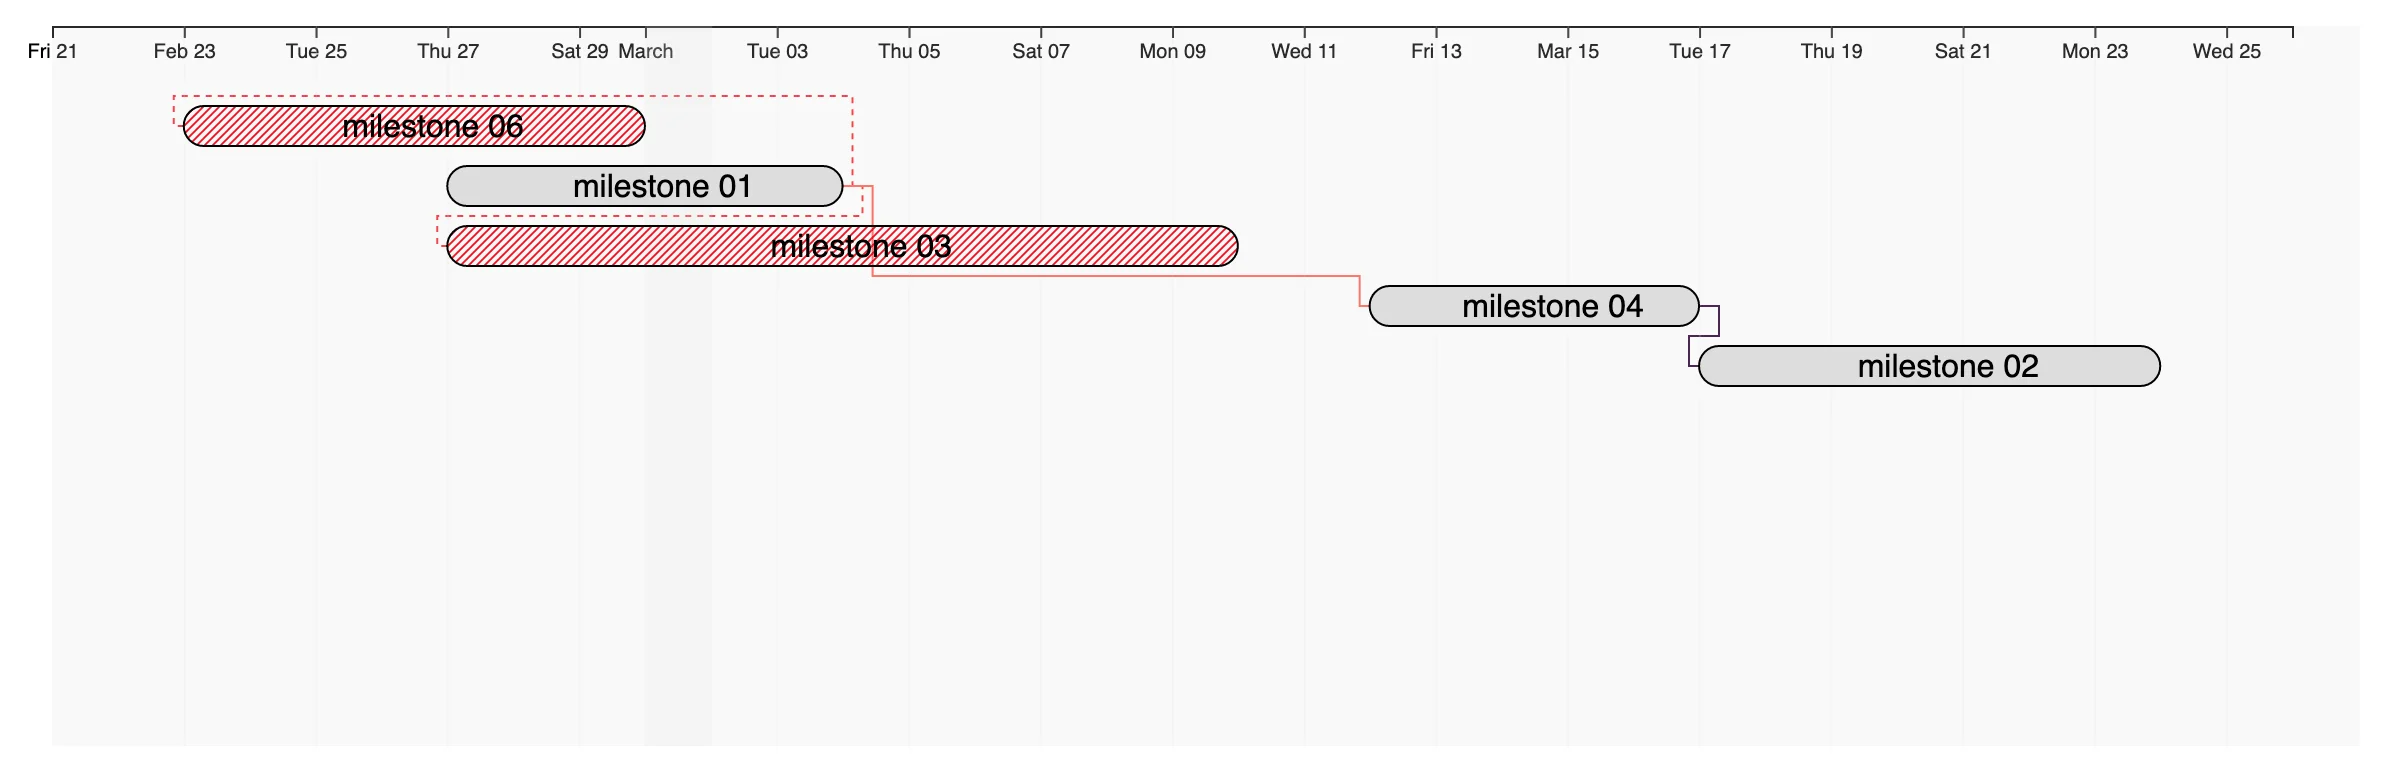
Yet I ended up implementing something more like this:
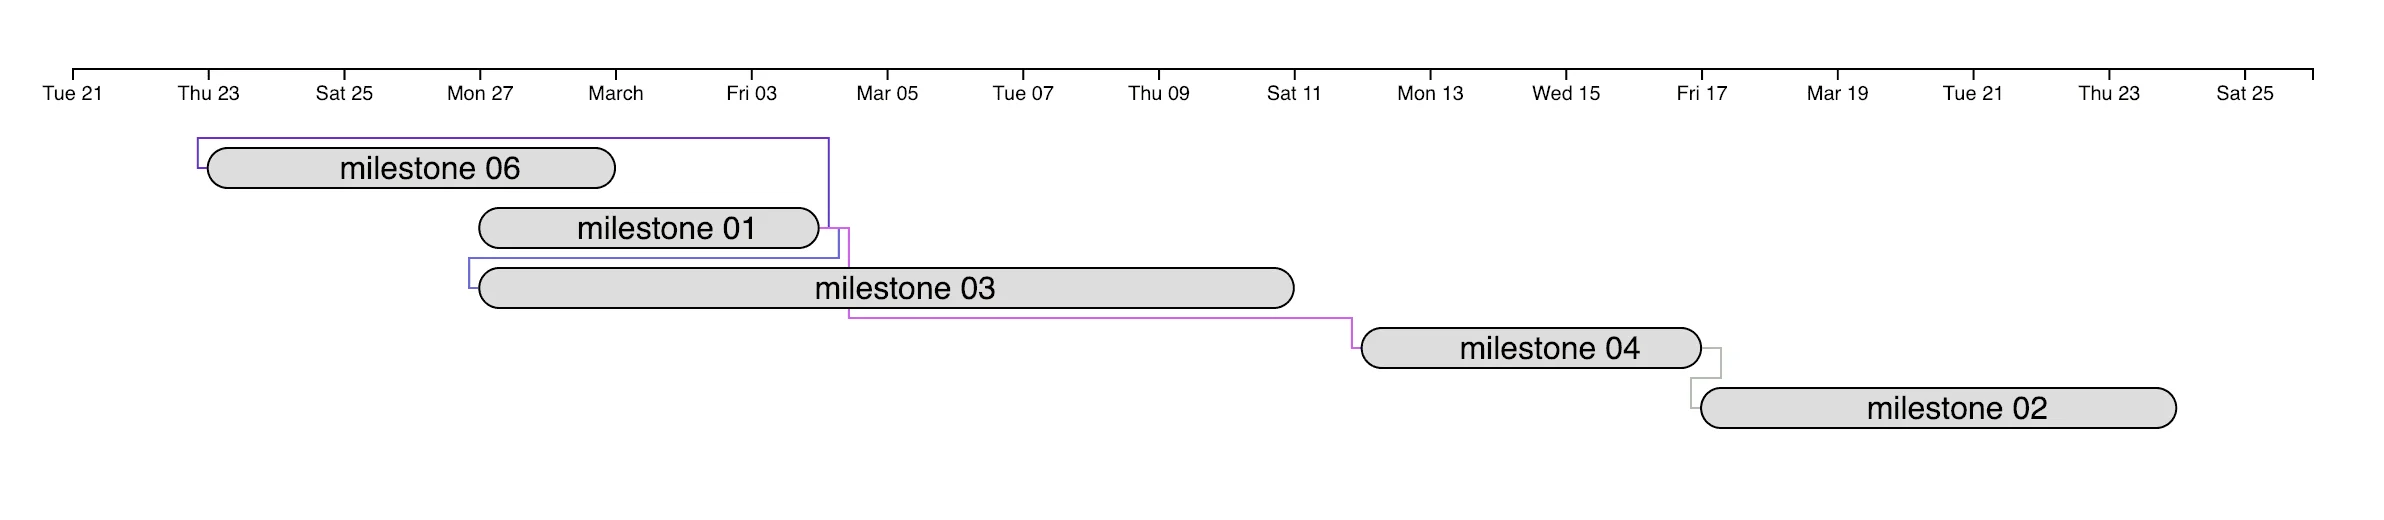
Does not look quite same, right? It also does not work quite same and lacks few quite important features too.
Don’t get me wrong, the original implementation did serve project needs, but it was not something anybody could simply use in their project management software and expect customers to love it.
Hence I came up with these complaints about the implementation:
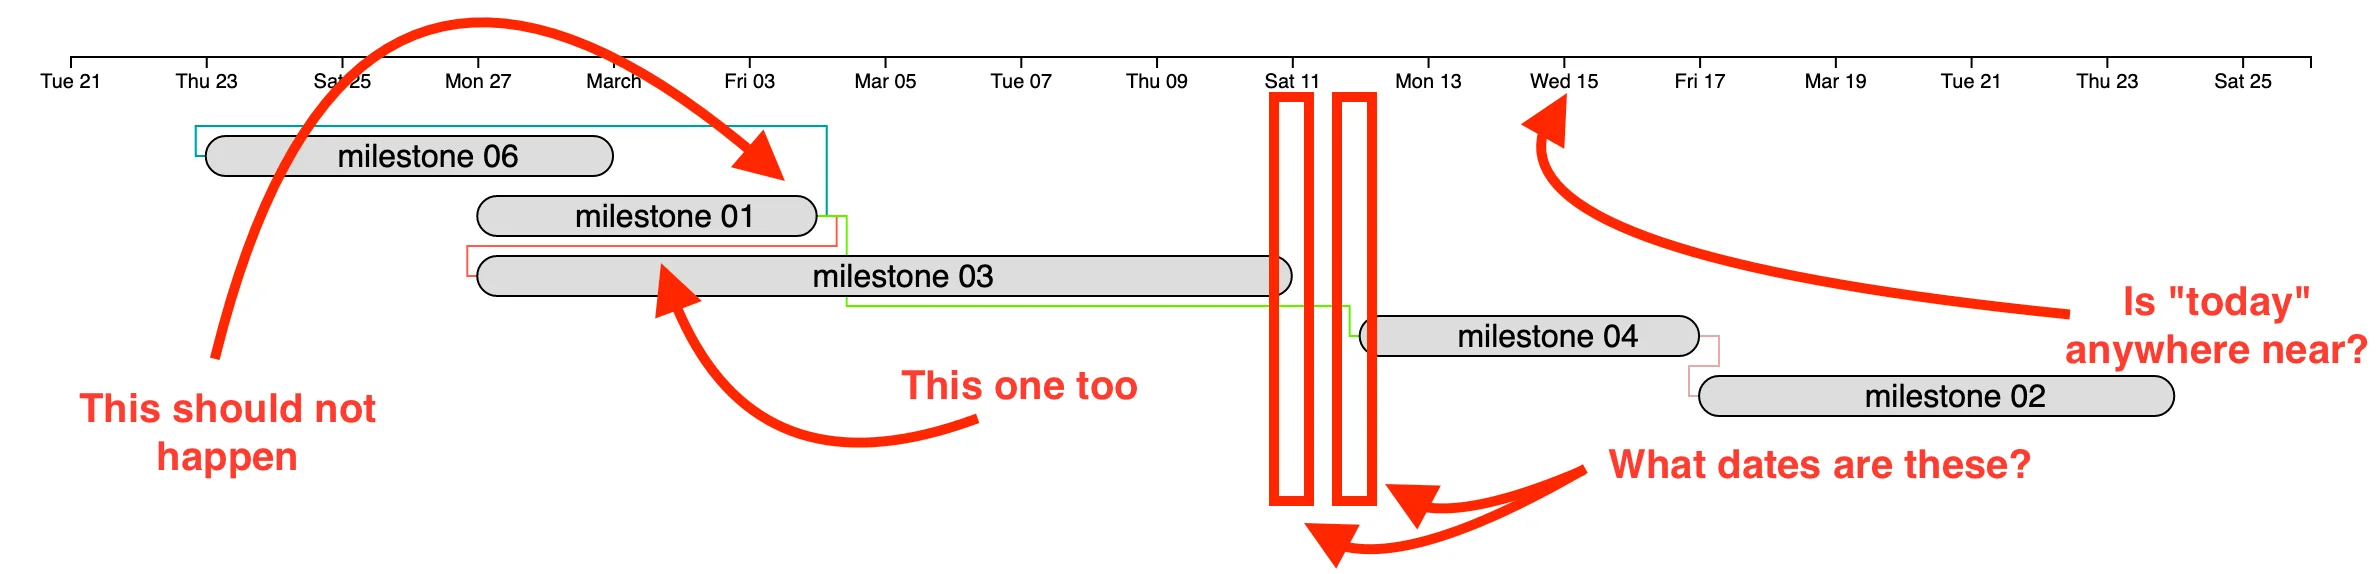
Namely, there are three main issues that I see:
- there is a place for mistakes: milestones are allowed to depend on later milestones or simultaneously going ones
- there is no clear distinction between the dates each specific milestone starts or ends
- if the milestones overlap with current timeframe, current day is not highlighted on the chart (and that often is useful)
Apart from that, there are few technical challenges preventing his whole thing from becoming a real application component:
- dependency lines look ugly with those sharp corners
- the implementation is not based on any framework neither does it declare its dependencies (like D3 or MomentJS)
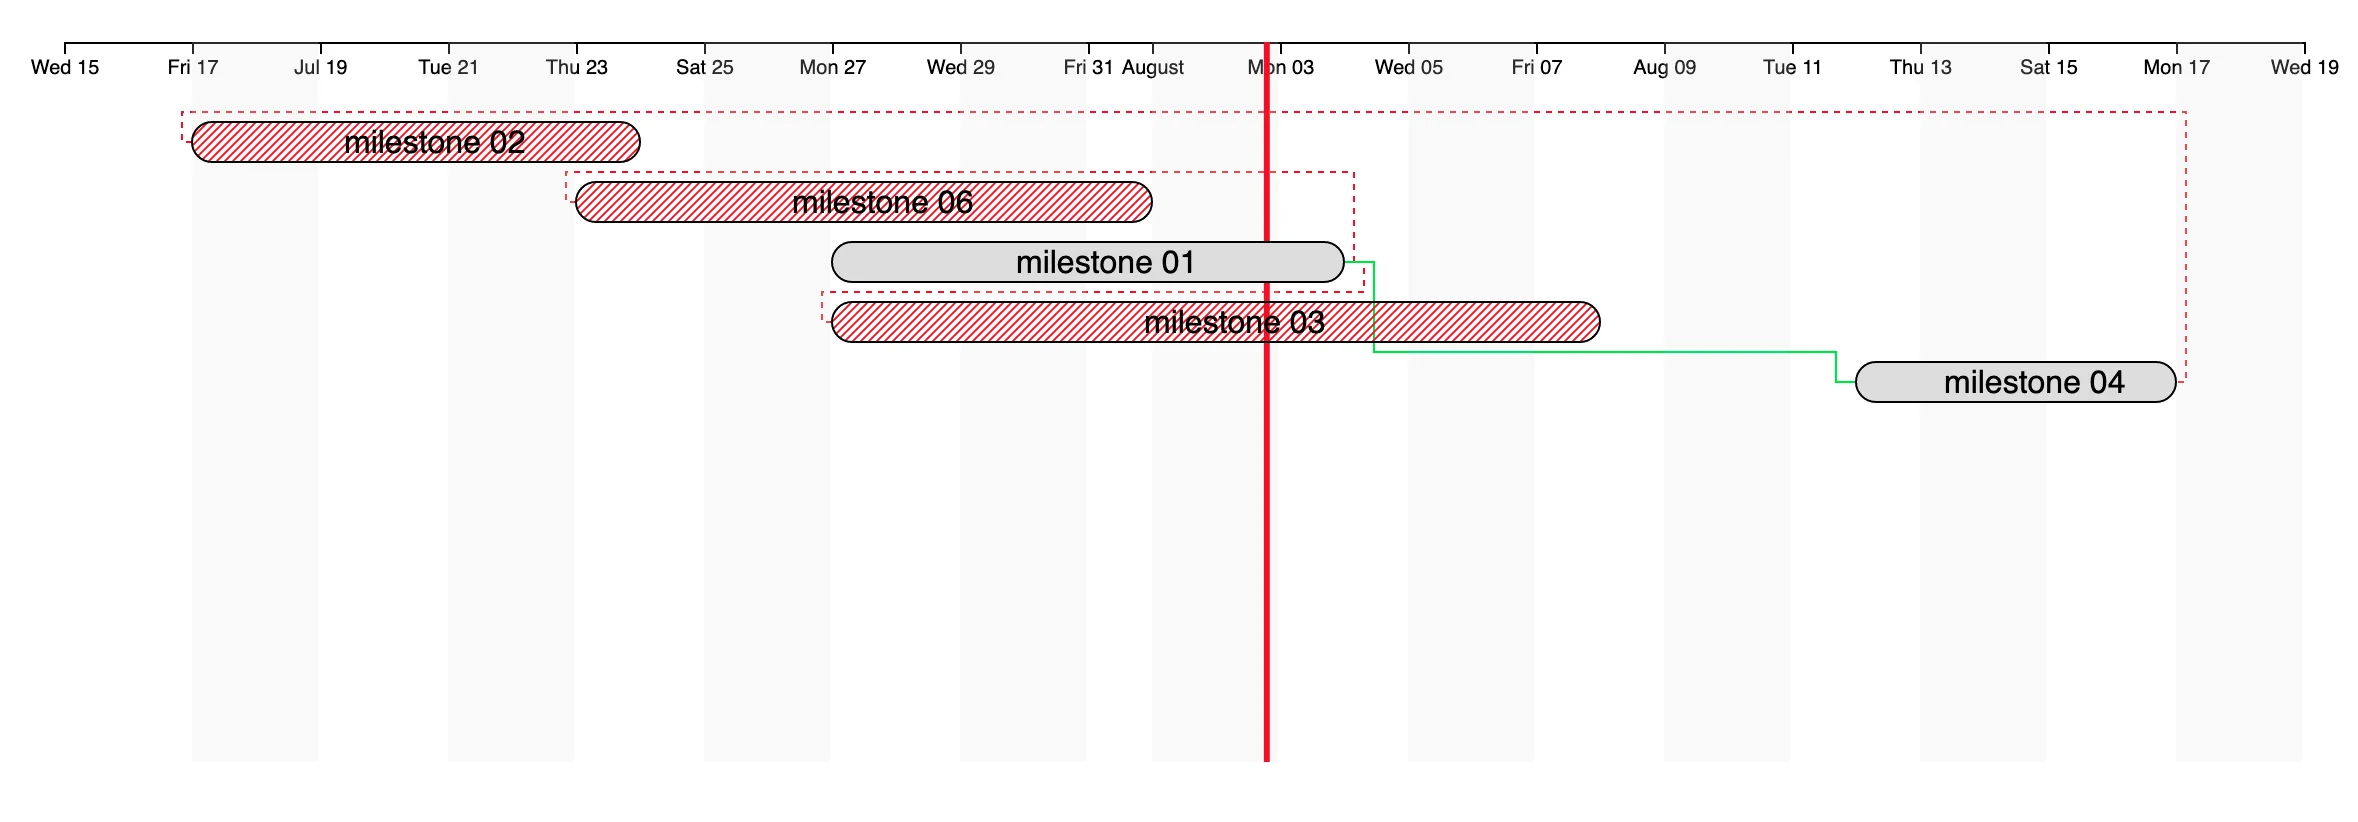
Now I want to revise the original implementation and make it a bit more usable, just like this:
The plan for this blog is:
- Technical improvements
- revise the implementation into a proper Node package
- optimize for bundle size
- Feature improvements
- render milestone conflicts in different style
- draw days on a background
- draw current date, if applicable
- make lines more like curves
Extracting into a package
Well this one is pretty easy - you just do npm init -y, add dependencies with npm install --save moment d3 and require them in your file.
I went a tiny bit further and also changed few minor syntactic inconsistencies to follow with the more modern ES syntax:
- using
importinstead ofrequire() - preferring
constoverletandvar - replacing the
Object.assignwith spread operator - passing in the default values to the function params instead of constantly checking for
nullandundefined
Bundling
Although the package declares the dependencies, it does not really use them. Well, it could, but only in case it would be used in the system which defined require() function.
D3 itself is a heavy package. Same applies to moment.js. If you bundle the library with anything (I have used Parcel to do it quickly), you’ll see that this relatively small library builds into a 500kB bundle.
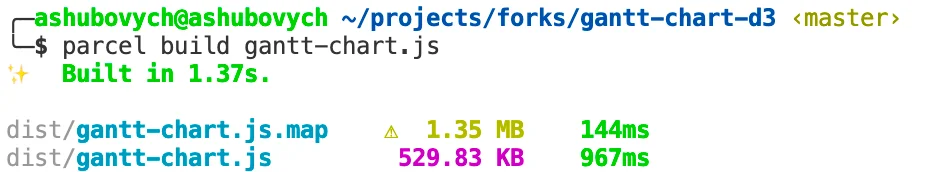
I think that is quite ridiculous, so here are few considerations:
- replace momentjs with something more lightweight
- import only specific packages from D3 instead of the whole thing
Let us actually start with D3.
The library currently operates on few features from D3:
- selecting DOM nodes
- drawing
- axes
- lines (actually, multilines or paths)
- rounded rectangles
- text
- scaling values (across timeframe)
These features actually come in just few D3 packages:
d3-axisd3-scaled3-select
import { axisBottom } from 'd3-axis';
import { scaleTime } from 'd3-scale';
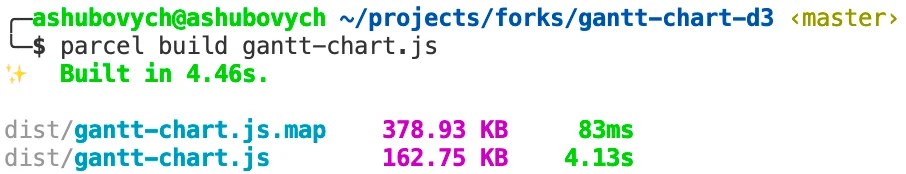
import { select } from 'd3-selection';By just using these three imports (and using these functions instead of their d3. counterparts), we can half the size of the bundle:

Some of the features (like drawing text) are actually just methods on the selection, provided by d3-select or the path object, provided by d3-path.
Optimizing even more
Currently, moment.js is used for few purposes:
- parse the dates
- sort the milestones by dates
- calculate the length of each milestone based on its start and end dates or either of those and a duration
Moment is quite a heavy thing. For now, let’s ignore date parsing and just replace the initial data with the Date object from the native APIs:
moment(date); // => date
date.toDate(); // => date
date.subtract(x); // => date - x
date.add(x); // => date + x
moment(string); // => new Date(string)
By doing so, we have cut another 60 kB off the bundle!
Before we do hardcore optimizations (getting rid of D3 itself), let us do a bit of feature work first.
Detecting conflicts
To figure out if a given milestone conflicts with any other milestones, we have to traverse its dependencies and check if any of those start on or after the current milestone’s start date.
Luckily the internal representation of a milestone already contains that data, so all we have to do is dependencies traversal:
const detectConflicts = data => {
  const dataCache = createDataCacheById(data);

  return data.map(milestone => {
    const errorousDependencies = milestone.dependsOn.filter(dependencyId => dataCache[dependencyId].startDate >= milestone.startDate);
    milestone.errors = (milestone.errors || []).concat(errorousDependencies.map(errorId => `Dependency ${errorId} must end before this milestone`));
    return milestone;
  });
};
Then we can render those milestones with errors and their connectivity lines with different styles:
let stroke = color;

if (d.errors.length > 0) {
  strokeDash = '3';
  stroke = '#d33';
}

linesContainer
  .selectAll('polyline')
  .data(polylineData)
  .enter()
  .append('polyline')
  .style('fill', 'none')
  .style('stroke', d => d.stroke)
  .style('stroke-dasharray', d => d.strokeDash)
  .attr('points', d => d.points);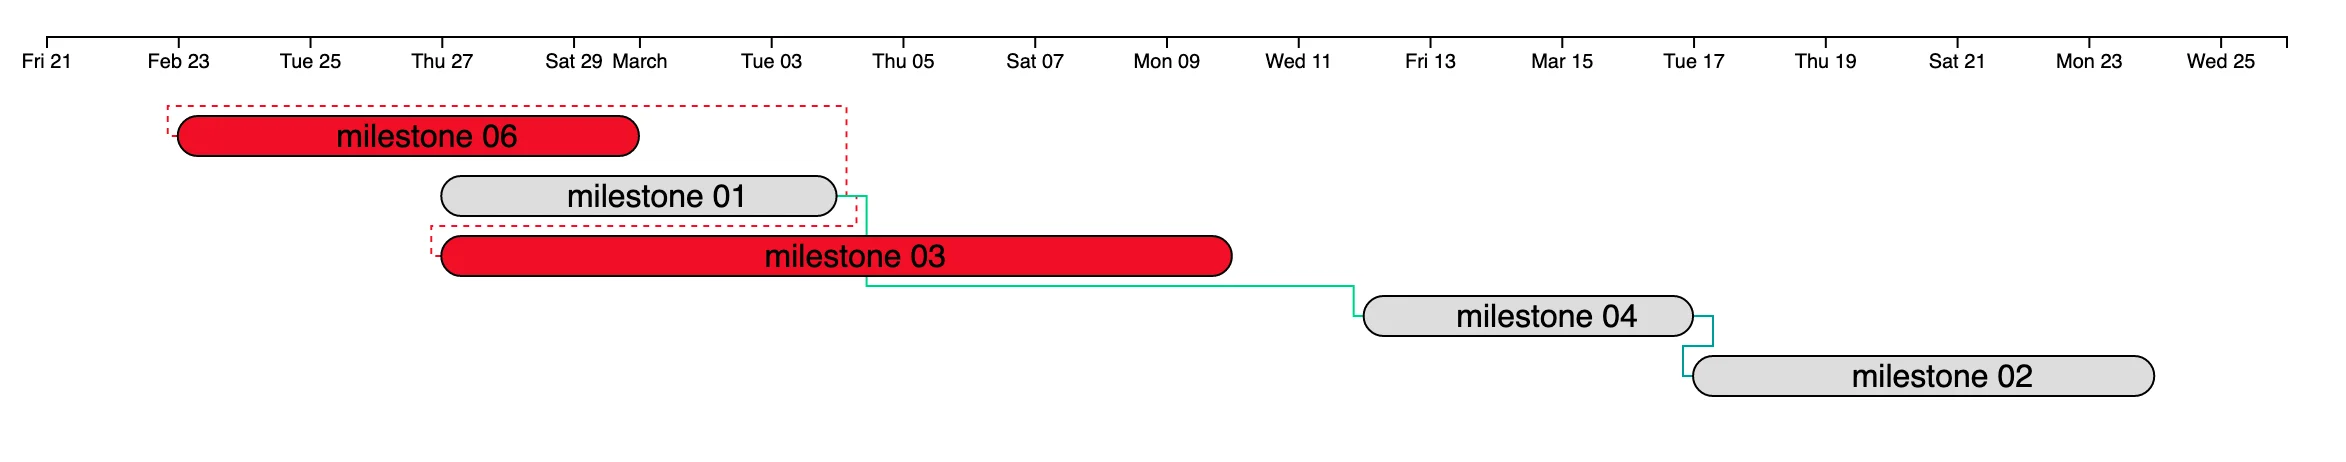
For milestones themselves we can add a pattern and make it striped:
// error style
svg.append('pattern')
  .attr('id', 'error-fill')
  .attr('patternUnits', 'userSpaceOnUse')
  .attr('width', '4')
  .attr('height', '4')
  .append('path')
  .attr('d', 'M-1,1 l2,-2 M0,4 l4,-4 M3,5 l2,-2')
  .style('stroke', '#d33')
  .style('stroke-width', '1');

bars
  .append('rect')
  .attr('rx', elementHeight / 2)
  .attr('ry', elementHeight / 2)
  .attr('x', d => d.x)
  .attr('y', d => d.y)
  .attr('width', d => d.width)
  .attr('height', d => d.height)
  .style('fill', d => d.errors.length > 0 ? 'url(#error-fill)' : '#ddd')
  .style('stroke', 'black');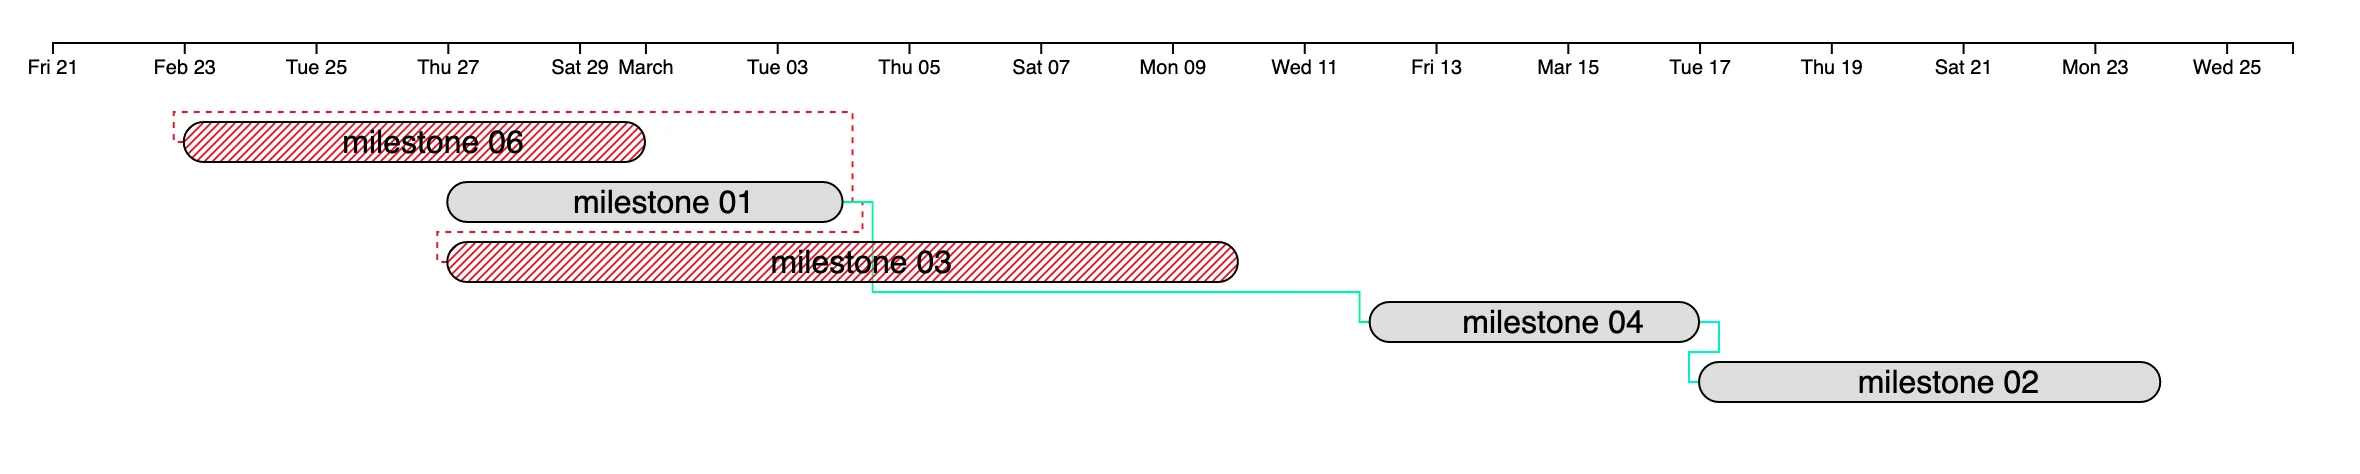
Displaying days on a background
We can leverage the features of a time scale that D3 provides us with to render the days on a background.
The scale, however, is not that easy - it operates on dates, so the width of each day is something we will have to calculate ourselves. It also might have extra ticks in between days (for the month change, for instance) - and that is something I am yet to overcome.
Long story short, before rendering the milestones and their connectivity lines, we can add a bunch of semi-transparent rectangles:
const grid = g1.append('g').call(xAxis);

grid
  .append('g')
  .selectAll('rect')
  .data(xScale.ticks())
  .enter()
  .append('rect')
  .attr('x', (d, i) => xScale(d))
  .attr('y', 0)
  .attr('height', svgHeight)
  .attr('width', (d, i) => svgWidth / xScale.ticks().length)
  .style('fill', '#dedede30');
As you can see, the width of a rectangle is being calculated based on the total width of an svg container and the amount of scale’s ticks.
One little change to this implementation that I would like to see is alteration in rectangles’ colors:
grid
  .append('g')
  .selectAll('rect')
  .data(xScale.ticks())
  .enter()
  .append('rect')
  .attr('x', (d, i) => xScale(d))
  .attr('y', 0)
  .attr('height', svgHeight)
  .attr('width', (d, i) => svgWidth / xScale.ticks().length)
  .style('fill', (d, i) => i % 2 ? '#dedede30' : '#dedede00');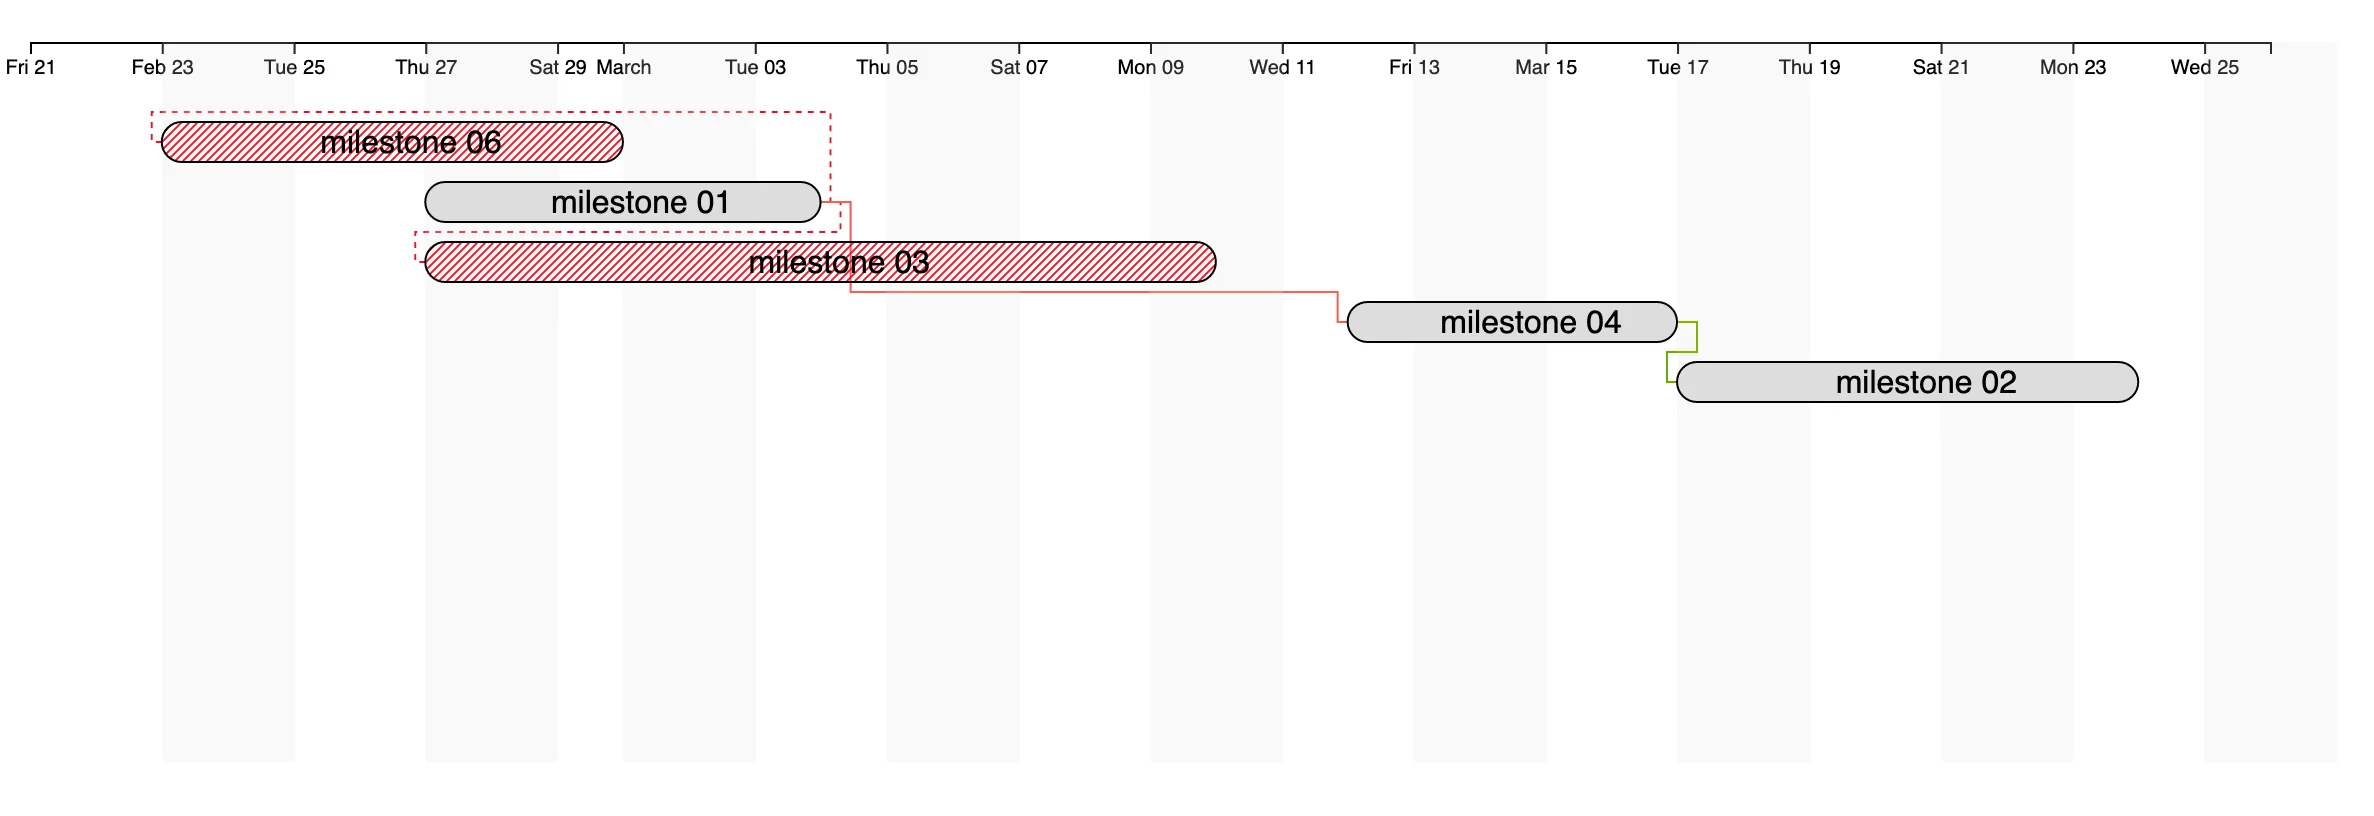
Highlighting the current date
Right before we draw the rectangles and even the axis itself (again, to prevent the overlapping), we can draw a line showing the current date, if it fits into the range of the chart. For this we can also leverage the properties of the xScale, this time .range(), which returns a two-element array, denoting the beginning and end values of the scale. Of course, we will have to convert the current date to the value on that scale too:
const nowOnScale = xScale(Date.now());

if (nowOnScale >= xScale.range()[0] && nowOnScale <= xScale.range()[1]) {
  grid
    .append('line')
    .attr('x1', nowOnScale)
    .attr('y1', 0)
    .attr('x2', nowOnScale)
    .attr('y2', svgHeight)
    .style('stroke', 'rgb(232, 102, 102)')
    .style('stroke-width', 3);
}
To be continued
The source code of this implementation could be found on Github.
I think that is enough for now, but it is not the end! There’s still some work to be done in removing the D3 from this setup completely, which is actually done in Gantt chart: part 3 blog.