Gantt chart with D3
Contents
- Gantt chart with D3 (you are here)
- Gantt chart with D3. Part 2
- Gantt chart with Canvas
- Gantt chart with CSS Grids
At work, I’ve had a task to implement a Gantt chart diagram to show dependencies and order of some… let’s say, milestones. Given this feature is in a very unstable beta in Google Charts, I thought to myself: “Why don’t I implement it on my own?”. And tried to recall my D3 knowledge.
I’ve also found a minimalistic, but helpful example / screenshot of some Gantt chart implementation:

The challenges I’ve faced were:
- order milestones on a timeline
- scale milestones to fit in a viewport
- create pretty connection lines
- center text inside each milestone
And since D3 is a data-driven library, I’ve used map/reduce where possible.
Here’s how the result looked like:
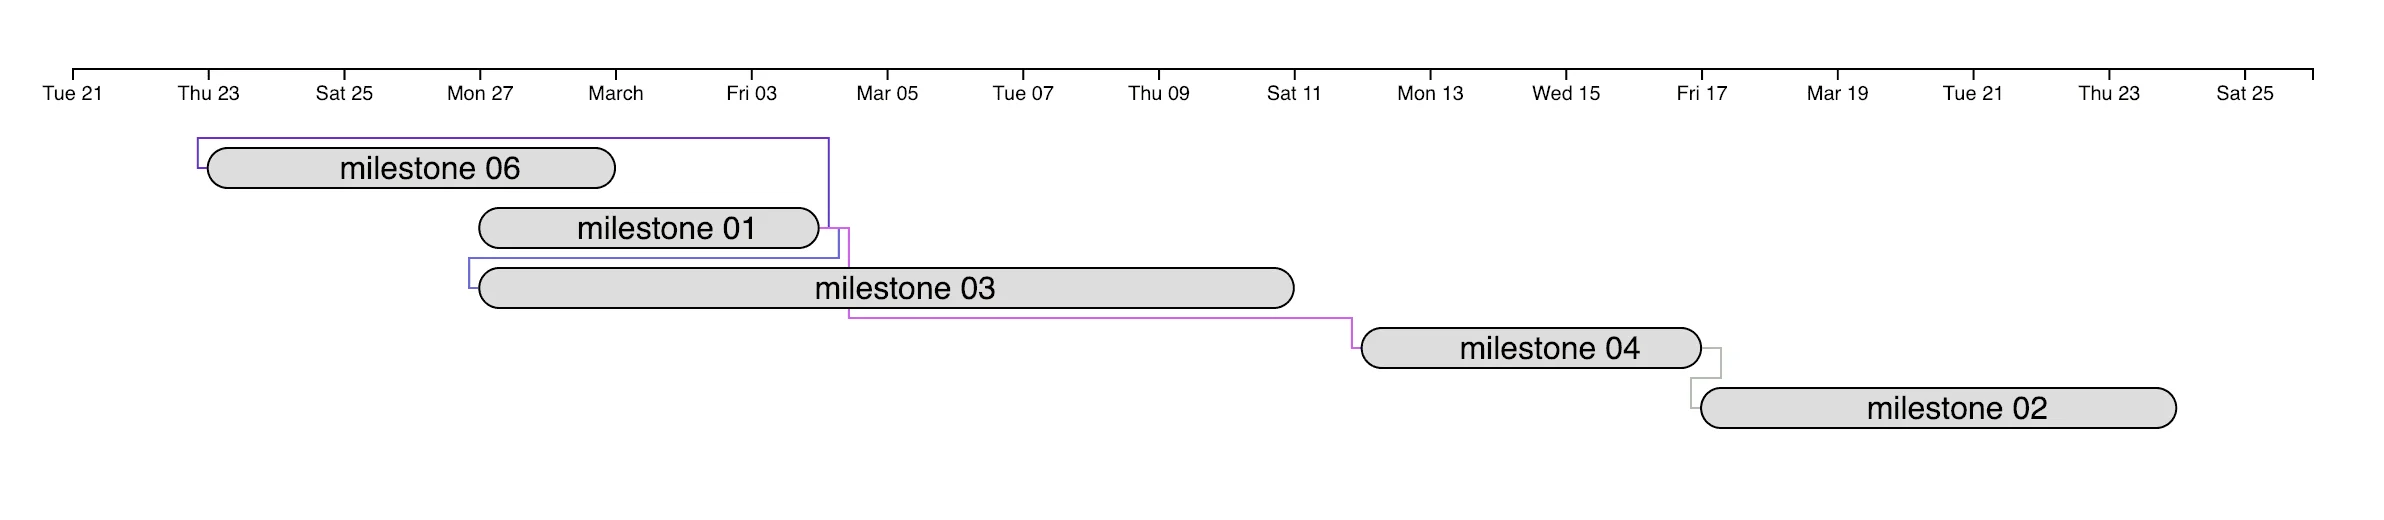
The implementation details are under the cut.
Update August 2020
There are few updates to this original implementation in my new blog.
I hope the implementation is more or less clear, but here are some details: the algorithm consists of three main parts - initial data pre-processing - (parsing and validating dates, calculating the default values and so on); calculating the graphics params (positions, sizes) and finally, rendering that into SVG.
I’ve tried using caches whenever possible to optimize the performance and save some calculation time by just creating maps id -> object, since the algorithm refers to objects by their IDs a lot (like getting all the children of an element or getting a particular child’s data).
The data pre-processing is basically computing the length of each element based on either startDate and endDate or startDate and duration. Adding the endDate and duration option is possible and trivial, but I thought this is a less useful feature.
The transformation of data is the most interesting part - we need to calculate the positions of each element on a “screen”, and it heavily relies on data sorting mode - if we need to sort the data by the amount of children - this is somewhat simple. But if we sort data by dates - we need to count for element’s index in the overall list of elements.
Then we calculate the parameters of connection lines. They might be redundant for some users, but in my case it was essential to show the dependencies between elements sorted by children count. This is less trivial, since one needs to find the bends of each line. Hence I decided to simplify this problem by putting all the lines under the rectangles and assuming every line consists of these sections:
- the “input” and “output” pins (near the
endDateend of a parent element and nearstartDateend of children element) - two vertical sections to reach the height of a children element
- a connection between the lines from p. 2
The last piece of an algorithm is generating SVG. This is where D3 strikes in and, given all the params generated in the previous section, creates SVG elements in DOM tree and scales them considering svgOptions passed to the main function.
The implementation is below and the live demo is here
import * as d3 from 'd3';
import moment from 'moment';

const prepareDataElement = ({ id, label, startDate, endDate, duration, dependsOn }) => {
  if ((!startDate || !endDate) && !duration) {
    throw new Error('Wrong element format: should contain either startDate and duration, or endDate and duration or startDate and endDate');
  }

  if (startDate) startDate = moment(startDate);

  if (endDate) endDate = moment(endDate);

  if (startDate && !endDate && duration) {
    endDate = moment(startDate);
    endDate.add(duration[0], duration[1]);
  }

  if (!startDate && endDate && duration) {
    startDate = moment(endDate);
    startDate.subtract(duration[0], duration[1]);
  }

  if (!dependsOn)
    dependsOn = [];

  return {
    id,
    label,
    startDate,
    endDate,
    duration,
    dependsOn
  };
};

const findDateBoundaries = data => {
  let minStartDate, maxEndDate;

  data.forEach(({ startDate, endDate }) => {
    if (!minStartDate || startDate.isBefore(minStartDate)) minStartDate = moment(startDate);

    if (!minStartDate || endDate.isBefore(minStartDate)) minStartDate = moment(endDate);

    if (!maxEndDate || endDate.isAfter(maxEndDate)) maxEndDate = moment(endDate);

    if (!maxEndDate || startDate.isAfter(maxEndDate)) maxEndDate = moment(startDate);
  });

  return {
    minStartDate,
    maxEndDate
  };
};

const createDataCacheById = data => data.reduce((cache, elt) => ({ ...cache, [elt.id]: elt }), {});

const createChildrenCache = data => {
  const dataCache = createDataCacheById(data);

  const fillDependenciesForElement = (eltId, dependenciesByParent) => {
    dataCache[eltId].dependsOn.forEach(parentId => {
      if (!dependenciesByParent[parentId])
        dependenciesByParent[parentId] = [];

      if (dependenciesByParent[parentId].indexOf(eltId) < 0)
        dependenciesByParent[parentId].push(eltId);

      fillDependenciesForElement(parentId, dependenciesByParent);
    });
  };

  return data.reduce((cache, elt) => {
    if (!cache[elt.id])
      cache[elt.id] = [];

    fillDependenciesForElement(elt.id, cache);

    return cache;
  }, {});
}

const sortElementsByChildrenCount = data => {
  const childrenByParentId = createChildrenCache(data);

  return data.sort((e1, e2) => {
    if (childrenByParentId[e1.id] && childrenByParentId[e2.id] && childrenByParentId[e1.id].length > childrenByParentId[e2.id].length)
      return -1;
    else
      return 1;
  });
};

const sortElementsByEndDate = data =>
  data.sort((e1, e2) => {
    if (moment(e1.endDate).isBefore(moment(e2.endDate)))
      return -1;
    else
      return 1;
  });

const sortElements = (data, sortMode) => {
  if (sortMode === 'childrenCount') {
    return sortElementsByChildrenCount(data);
  } else if (sortMode === 'date') {
    return sortElementsByEndDate(data);
  }
}

const parseUserData = data => data.map(prepareDataElement);

const createPolylineData = (rectangleData, elementHeight) => {
  // prepare dependencies polyline data
  const cachedData = createDataCacheById(rectangleData);

  // used to calculate offsets between elements later
  const storedConnections = rectangleData.reduce((acc, e) => ({ ...acc, [e.id]: 0 }), {});

  // create data describing connections' lines
  return rectangleData.flatMap(d =>
    d.dependsOn
      .map(parentId => cachedData[parentId])
      .map(parent => {
        const color = '#' + (Math.max(0.1, Math.min(0.9, Math.random())) * 0xFFF << 0).toString(16);

        // increase the amount rows occupied by both parent and current element (d)
        storedConnections[parent.id]++;
        storedConnections[d.id]++;

        const deltaParentConnections = storedConnections[parent.id] * (elementHeight / 4);
        const deltaChildConnections = storedConnections[d.id] * (elementHeight / 4);

        const points = [
          d.x, (d.y + (elementHeight / 2)),
          d.x - deltaChildConnections, (d.y + (elementHeight / 2)),
          d.x - deltaChildConnections, (d.y - (elementHeight * 0.25)),
          parent.xEnd + deltaParentConnections, (d.y - (elementHeight * 0.25)),
          parent.xEnd + deltaParentConnections, (parent.y + (elementHeight / 2)),
          parent.xEnd, (parent.y + (elementHeight / 2))
        ];

        return {
          points: points.join(','),
          color
        };
      })
  );
};

const createElementData = (data, elementHeight, xScale, fontSize) =>
  data.map((d, i) => {
    const x = xScale(d.startDate.toDate());
    const xEnd = xScale(d.endDate.toDate());
    const y = i * elementHeight * 1.5;
    const width = xEnd - x;
    const height = elementHeight;

    const charWidth = (width / fontSize);
    const dependsOn = d.dependsOn;
    const id = d.id;

    const tooltip = d.label;

    const singleCharWidth = fontSize * 0.5;
    const singleCharHeight = fontSize * 0.45;

    let label = d.label;

    if (label.length > charWidth) {
      label = label.split('').slice(0, charWidth - 3).join('') + '...';
    }

    const labelX = x + ((width / 2) - ((label.length / 2) * singleCharWidth));
    const labelY = y + ((height / 2) + (singleCharHeight));

    return {
      x,
      y,
      xEnd,
      width,
      height,
      id,
      dependsOn,
      label,
      labelX,
      labelY,
      tooltip
    };
  });

const createChartSVG = (data, placeholder, { svgWidth, svgHeight, elementHeight, scaleWidth, fontSize, minStartDate, maxEndDate, margin, showRelations }) => {
  // create container element for the whole chart
  const svg = d3.select(placeholder).append('svg').attr('width', svgWidth).attr('height', svgHeight);

  const xScale = d3.scaleTime()
    .domain([minStartDate.toDate(), maxEndDate.toDate()])
    .range([0, scaleWidth]);

  // prepare data for every data element
  const rectangleData = createElementData(data, elementHeight, xScale, fontSize);

  const xAxis = d3.axisBottom(xScale);

  // create container for the data
  const g1 = svg.append('g').attr('transform', `translate(${margin.left},${margin.top})`);

  // add milestone relationship lines to the SVG
  if (showRelations) {
    // create data describing connections' lines
    const polylineData = createPolylineData(rectangleData, elementHeight);

    const linesContainer = g1.append('g').attr('transform', `translate(0,${margin.top})`);

    linesContainer
      .selectAll('polyline')
      .data(polylineData)
      .enter()
      .append('polyline')
      .style('fill', 'none')
      .style('stroke', d => d.color)
      .attr('points', d => d.points);
  }

  // append milestones only after we have rendered the connections to prevent lines overlapping the milestones
  const barsContainer = g1.append('g').attr('transform', `translate(0,${margin.top})`);

  g1.append('g').call(xAxis);

  // create axes
  const bars = barsContainer
    .selectAll('g')
    .data(rectangleData)
    .enter()
    .append('g');

  bars
    .append('rect')
    .attr('rx', elementHeight / 2)
    .attr('ry', elementHeight / 2)
    .attr('x', d => d.x)
    .attr('y', d => d.y)
    .attr('width', d => d.width)
    .attr('height', d => d.height)
    .style('fill', '#ddd')
    .style('stroke', 'black');

  bars
    .append('text')
    .style('fill', 'black')
    .style('font-family', 'sans-serif')
    .attr('x', d => d.labelX)
    .attr('y', d => d.labelY)
    .text(d => d.label);

  bars
    .append('title')
    .text(d => d.tooltip);
};

export const createGanttChart = (placeholder, data, { elementHeight, sortMode = 'date', showRelations = true, svgOptions }) => {
  // prepare data
  const margin = (svgOptions && svgOptions.margin) || {
    top: elementHeight * 2,
    left: elementHeight * 2
  };

  const scaleWidth = ((svgOptions && svgOptions.width) || 600) - (margin.left * 2);
  const scaleHeight = Math.max((svgOptions && svgOptions.height) || 200, data.length * elementHeight * 2) - (margin.top * 2);

  const svgWidth = scaleWidth + (margin.left * 2);
  const svgHeight = scaleHeight + (margin.top * 2);

  const fontSize = (svgOptions && svgOptions.fontSize) || 12;

  data = parseUserData(data); // transform raw user data to valid values
  data = sortElements(data, sortMode);

  const { minStartDate, maxEndDate } = findDateBoundaries(data);

  // add some padding to axes
  minStartDate.subtract(2, 'days');
  maxEndDate.add(2, 'days');

  createChartSVG(data, placeholder, { svgWidth, svgHeight, scaleWidth, elementHeight, scaleHeight, fontSize, minStartDate, maxEndDate, margin, showRelations });
};
The data format is like follows
const data = [
  {
    startDate: '2017-02-27',
    endDate: '2017-03-04',
    label: 'milestone 01',
    id: 'm01',
    dependsOn: []
  }, {
    startDate: '2017-02-23',
    endDate: '2017-03-01',
    label: 'milestone 06',
    id: 'm06',
    dependsOn: ['m01']
  }, {
    duration: [7, 'days'],
    endDate: '2017-03-24',
    label: 'milestone 02',
    id: 'm02',
    dependsOn: ['m04']
  }, {
    startDate: '2017-02-27',
    duration: [12, 'days'],
    label: 'milestone 03',
    id: 'm03',
    dependsOn: ['m01']
  }, {
    endDate: '2017-03-17',
    duration: [5, 'days'],
    label: 'milestone 04',
    id: 'm04',
    dependsOn: ['m01']
  }
];
To create a chard on a page, you need to pass the reference to a valid existing DOM element where you want the diagram to appear, the data and the SVG options. These options define the looks of a chart - width, height of an element (rectangle), font size and so on. One more option is
createGanttChart(document.querySelector('body'), data, {
  elementHeight: 20,
  sortMode: 'date', // alternatively, 'childrenCount'
  svgOptions: {
    width: 1200,
    height: 400,
    fontSize: 12
  }
});
A lot of things are happening here. In short, here are few key points:
- we have to render entities (milestones, lines, labels) in a specific “layered” order, to prevent one set of things covering the other
- it is both good for performance and is kind of a requirement to calculate the data before rendering it